THE IMPORTANCE OF EARNED VALUE MANAGEMENT IN DESIGN FIRMS
Introduction
The Architectural, Engineering and Construction (AEC) industry is traditionally known for not being great at project management, especially with time management. In my experience, particularly with design and construction, you have so many factors to consider that you can literally lose your mind trying to keep track of everything. In this industry, and speaking specifically of organization, the Project Manager (PM) is required to keep tabs on hundreds of activities to ensure a successful outcome.
So how do you manage to stay on top of everything without going crazy? Well the use of the right tools is a good place to start. Currently, the market offers so many tools that as a PM you can spend countless hours trying to decide which one works for you. As a design professional, and having worked on projects such as the BMW Central Office Building at their Mexico Plant, I too found myself on that journey to choose the correct tool for managing tasks and project delivery schedule. In my seven years as a design professional I have tried everything from Podio to Asana and from Project to Primavera. So which is the best option? The answer is depends, yet all but none. Okay I know that rises more question marks than answers however I believe that none of them will work if you as a Project Manager do not stick to the basics. You could be a highly skilled PM and manage to work with a simple spreadsheet, or alternately you could not know the first thing about project management and use the most expensive cloud solution and have a disastrous outcome.
Having studied both the IPMA and PMI approaches to project management, the first thing that I looked for in managing my projects is the ability to measure the results of our work vs the projected models. This for starters gives me future insights on how to better predict and even quote upcoming projects. Secondly, this data also helps me determine how productive the team is when working.
Project Management is such an extensive topic that I could probably write a book about it, however the purpose of this article is to focus on Earned Value Management and Time Tracking so I will keep it simple and to the point, and also try to keep in layman’s terms.
Earned Value Management (EVM)
So one important term to all Project Managers is Earned Value, and no, it’s not the left over cash from project that the project manager gets to keep. Earned Value Management is the process of measuring the project’s scope, time, and cost. A mathematical approach to determining the performance and progress of a project. For us to determine the Earned Value of a project we must first understand several important topics.
We will use a very simple example to explain EVM, in this case let’s suppose that we are doing a simple structural design that was quoted at $5,000 USD, to be delivered in 8 weeks with 3 milestones: 50% at week 4, 75% at week 6, and 100% at week 8. For the purpose of this article we will run our EVM analysis at the end of week 4.
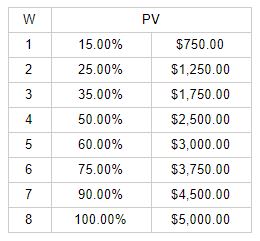
Planned Value (PV)
The first concept is Planned Value (PV) which is pretty straight forward, this value shows planned progress and cost at a specific date. In this example we established the following values:
Earned Value (EV)
This is where it gets interesting, Earned Value is the current progress (%) of scope multiplied by the Budget at Completion (BAC) or the project’s total budget. We represent EV with the following equation:
EV = BAC x Real Progress %
For this example we used the following values:
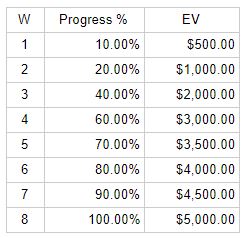
Our Budget at Completion (BAC) is $5,000 USD, so if we use the formula at week 4, where we have a 60% progress, we should have spent $3,000 (5,000 x 0.60 = 3,000) of our total project budget meaning our EV at week 4 = $3,000
At this point all we know is what the planned progress should be and what our actual progress is. Note: the actual progress percentage needs to be a calculation based on the completion of tasks from our Work Breakdown Structure (WBS), there are many methods for working with the Work Breakdown Structure but we won’t get into that right now.
If we graph these results we get the following (the blue line is planned progress and the green line is Earned Value (EV):
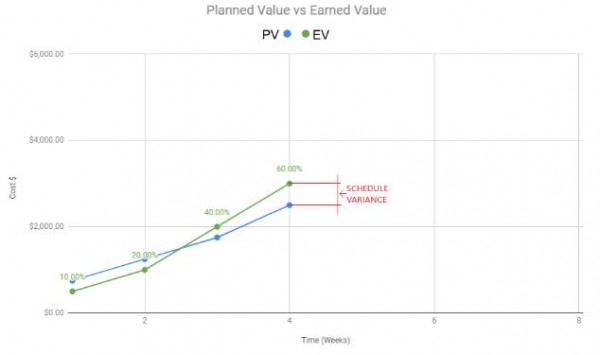
Here we can see that weeks 1 & 2 started behind schedule, however at week 3 and 4 we got ahead of schedule. At week 4, we are supposed to have a 50% progress but we currently have a 60% progress, meaning that we are ahead of schedule (that’s a good thing).
Actual Cost (AC)
Now that we know how our project is coming along in regards to the schedule, the next step is to analyze our project in relation to budget. The same EV table and graph will help us with this task, we must create an additional graph using the Actual Cost (AC) table. For the purpose of this example we will use the following data:
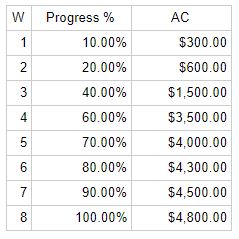
If we graph these results we can see that at week 4, with our current progress, we should have spent $3,000 (as per EV week 4) however we have actually spent $3,500, we have a budget variance of +$500, meaning we are over budget.
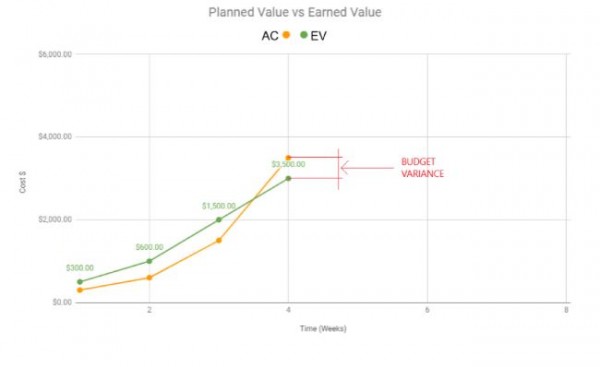
In this particular case the Project Manager should analyze why they have spent more than the budget allows at the current progress and take corrective actions. The fact that the project is ahead of schedule is a good thing, however there are red flags in relation to the budget. In project management, the variances (both schedule and budget) allow the project manager to make reparative decisions or adjustments.
Time Tracking and Productivity
Now that we know about Earned Value Management we need to understand why time tracking is important and how managing productivity can help keep our budget on track. For starters, and for our purposes, productivity is the effectiveness of work being done. Not only does it depend on time, but also quality. The quality aspect of productivity is another topic that we will discuss at a later time, for the time being we will focus on time.
The design phase of the AEC process is composed mostly of time costs. This is why we need to keep strict control of how time is invested. A good practice is to track time, even if your staff is on a fixed salary. The measurement of adherence, which we will say is the comparison of time at the office vs productive time, is important to understand productivity from a “time” vantage point. For example, if a drafter is on an 8 hour salary but is only working 6 productive hours, he/she has an adherence of 75%, where 25% of the 8 hours are not productive. This in simple terms seems easy to do, but how do you determine how much time is productive?
A good place to start is to use time tracking software. We can find options that automatically track time based on what software we are using or if there is activity on our computer. There are quite a bit of options on the market, some free and some at a cost per user. Most of them share the same base of having the ability to take periodic screenshots (this can be turned on or off as needed).
Personally I have found that TopTracker (which is free and I currently use it myself) is a great tool for this. It gives the user the freedom of when he/she wants to start tracking time so that personal time isn’t being tracked. Additionally you can create reports per user or per project which can be great for invoicing purposes. Based on these reports, I have come to the conclusion that in most cases you typically have anywhere from 5 to 7 hours of productive time in an 8 hour day of drafting. If a drafter is jumping between projects and has nothing to work with that can go down to even 4 hours a day.
In conclusion, that which cannot be measured cannot be improved. Project Management is based on this premise as the leader of the team needs to know how things are coming along and if they can be improved in any way. As I stated at the beginning, you can use any software or tools that you want, but as long as you don’t stick to the basics your efforts can be futile. Remember that when working on whatever (from construction to a bakery) everything you do produces data, that data can help us understand if things are moving smoothly or if we are deep water. So always measure, compare, analyze any and all data that is important to your daily activities.

Leave A Comment